For many years, science has emphasised the importance of transparency. We, the team behind 13Leaders, would like to meet this requirement. Therefore, on this page, you will find the evaluation of our current status and a description of the theoretical background to the 13Leaders check. We want to take you through the entire process, from initial idea, to the design of the questionaire. This includes: Where do we come from? Where are we now? And where will we go from here?
IMPORTANT: If you have not yet taken the test, please do so before reading on. Knowing too much about the test can influence your answers, we don’t want that, and neither do you. 😉.
For over 100 years, organisations have been searching for the right leadership style. It was argued in terms of the Great Man Theory for a long time that leadership is a trait (Carlyle, 1888). That is, leadership is in the blood and intuitive. Such trait theories do not provide much behavioural guidance for leaders since leadership occurs according to traits. This further implies that leaders must possess a similar repertoire of traits that increase the likelihood of becoming a leader. However, we have known for some time that personality traits can only explain a small portion of leadership potential (House and Shamir, 1993).
In the early 20th century, employees were still rewarded with high pay and fewer working hours. Leadership was authoritarian (Taylor, 1911). Due to the growing dissatisfaction with working conditions, authoritarian leadership style, and the increasing influence of unions, neoclassical organizational theories emerged. Famous studies, such as that of Roethlisberger and Dickson, who became known for the Hawthorne Effect, suggested that social factors and job satisfaction had a more substantial influence on behavior than monetary stimuli (Roethlisberger & Dickson, 2003). Likert concluded that groups have an enormous influence on the behavior of individuals in an organization.
For management, this meant, among other things: Flat hierarchies, overlapping work groups, motivation, and a wide span of control that allowed employee decisions (Likert, 1961).
Work was humanized and employees’ mental and physical abilities were enhanced, increasing productivity (Maslow, 1954; Herzberg, 1959). Emery and Thorsrud coined the term sociotechnical system and brought a new view of organizations, again expanding the tasks of management (Emery & Thorsrud, 1969). The maturity model with its situational approach to leadership changed the understanding of leadership again. (Hersey & Blanchard, 1977)
Now it is not only the personality traits of the leader, neither the motivation and skills of the employees, or the systemic characteristics of an organisation that leaders have to consider, but it is each situation that should be accompanied by a different leadership style (Hersey & Blanchard, 2007). The transactional and transformational leadership approaches are followed. Leaders can choose between the extrinsic motivation of employees and intrinsic motivation depending on the task. Leaders can create a vision and meaning for their employees. They can challenge them intellectually and respond to them individually (Kuhnert & Lewis, 1987).
So over the last hundred years, leadership has evolved from an autocratic authority to a democratic, delegating authority.
Successful leaders can take multiple approaches to leadership. They motivate, encourage, and challenge their employees. They set goals, coordinate, review progress, and evaluate performance (Daft, 2015).
„
Why do we see leadership behaviour in all human communities all over the world?
All these leadership theories interpret how people lead. We ask ourselves, why is leadership practiced? Why do we see leadership behavior in people all over the world? Evolutionary psychology also tries to answer this question. Evolutionary psychology builds on a simple logical proposition. If the bodies of all organisms, animals, and humans are the result of evolution, then the same is true for our brains. And our brain is us if you want to get philosophical. Our experience and behavior are therefore subject to the evolutionary mechanisms that are also responsible for the fact that female peacocks recognize the health of a male peacock by his plumage.
Evolution did not begin with humans. That’s why we also look at our relatives in the animal kingdom. Leadership has also evolved in the wild as a solution to the challenges of some species. Nevertheless, we recognize commonalities in qualities that we currently expect from a leader in humans as well. For example, it is the experienced matriarchs that lead orcas and African elephants in herd movements (van Vugt & Smith, 2019). Leadership, however, is not something rigid in the animal kingdom. For example, lactating zebras initiate herd movements, due to their increased energy demands (Fischhoff et al., 2007). And contrary to what is often portrayed, it is not always about eating or being eaten.
As in the animal kingdom, leadership positions provide an individual with prestige and standing. However, such leadership positions only relate to a specific situation or task. Someone good at hunting does not dictate to the gatherers how they should operate. The Navajo have a leader for war, peace, medicine, hunting, and ceremonies (Shepardson, 1963). To avoid authoritarian leaders, some mechanisms intervene as soon as someone becomes too greedy for power (Boehm & Boehm, (2009).
Many evolutionary psychologists distinguish leadership among two types. Prestige-style and dominance-style. Dominance-style leadership works through aggression and is forced on the rest of the group by physically superior males. Prestige-style leadership works by persuading and admiring. To do this, the leader must be charismatic and bring special qualities to the table (Henrich, 2016). A detailed discussion of evolutionary leadership is beyond the scope of this paper.
The findings from research on leadership raise the suspicion that there is no one-size-fits-all approach to leadership. Different situations and tasks call for different approaches to leadership. With this knowledge as an insight, we define leadership as a task that is solved by the leader and followers together. (Alznauer, M., 2016).
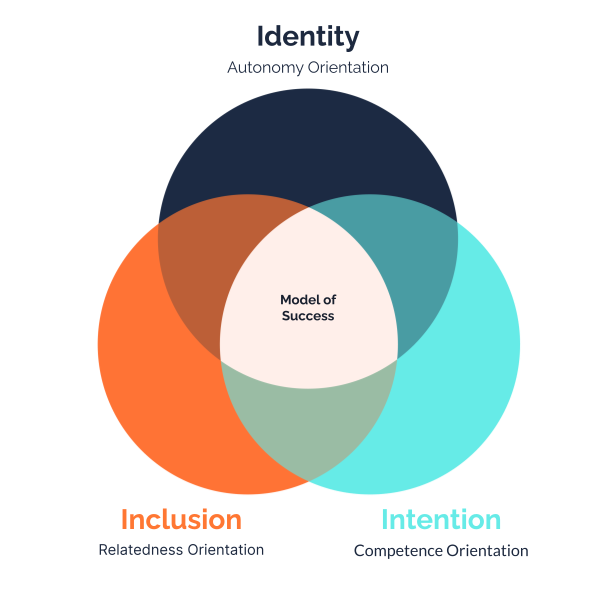
Therefore, how leaders solve theirs tasks, has also something to do with their motivation, why they accepted responsibility for this task in the first place. Insofar as this decision was self-determined, the orientation can be traced back to three distinct human needs (Deci et al., 2017), which are aligned with the three dimensions of identity, intention and inclusion. These shape the behaviour of leaders. Leaders differ in the strengths and preferences within these dimensions.
The 13Leaders Framework
Identity, Intention and Inclusion
In the 13Leaders framework, leadership is viewed through the lens of Evolutionary Leadership Theory (ELT), which incorporates SDT principles. Self-Determination Theory (SDT) has important implications for leadership within the 13Leaders framework.
Here’s how SDT relates to leadership within the 13Leaders framework:
Meeting Basic Needs: SDT asserts that individuals have three fundamental psychological needs—autonomy (identity), competence (Intention), and relatedness (inclusion). Effective leaders within the 13Leaders framework understand the importance of satisfying these basic needs for their self, their team members and their organisations. They establish an individual presence, create environments and leadership styles that support autonomy by providing choices and promoting self-efficacy, foster competence by offering opportunities for skill development, and nurture relatedness by building positive relationships and a sense of belonging within themselves, their teams and their organisations.
Motivation and Engagement: SDT emphasizes the role of intrinsic motivation in driving behavior. Leaders in the 13Leaders framework recognize that when individuals’ basic psychological needs are met, they are more likely to be intrinsically motivated and engaged in their work. Leaders, therefore, strive to align the goals and tasks of their team members with their personal values and interests, fostering a sense of ownership and enthusiasm.
Adaptive Leadership Styles: The 13Leaders framework categorizes leadership types based on their efficiency in performing seven essential leadership functions. Leaders are encouraged to adapt their leadership style based on the specific needs of their team and the situation. This adaptability aligns with the SDT principle of supporting autonomy, as leaders should allow team members to have some control over how tasks are performed.
People tend to follow those, who demonstrate self-efficacy and confidence (Fransen et al., 2016). Self-confident leaders, for one, may be viewed as charismatic, more attractive, and motivate employee job involvement (Bandura, 1986; Vroom, 1964). According to De Cremer and van Knippenberg (2004), self-confident leaders can be expected to tend to self-sacrifice on the job and create identification on the part of employees with the leader. Charisma may have evolved to quickly form groups and collectively solve an acute problem (Grabo, Spisak & van Vugt, 2017).
Building Positive Relationships: Relatedness, one of the basic psychological needs in SDT, highlights the importance of social connections and belonging. Leaders in the 13Leaders framework recognize the significance of positive relationships and collaboration within their teams. They create a supportive and inclusive environment where team members feel valued and connected.
Relatedness goes beyond influencing others to achieve overall organisational goals. Successful leaders build relationships with others based on trust and respect (Hogan & Kaiser, 2005). Studies support the importance of leader behaviour for motivation and behaviour (Gilbert & Kelloway, 2014). In addition, there is a growing literature on the positive impact of leadership behaviour on motivation (Barling et al., 2010). Leaders can be responsive to others, provide opportunities for decision-making and input, and inform rather than control (Baard et al. 2004; Hadre & Reeve 2009; Su and Reeve 2011). This allows leaders to increase engagement and promote intrinsic motivation (Deci et al., 2017).
Promoting Growth and Development: SDT’s competence need aligns with the leadership function of helping individuals develop their skills and achieve mastery. Effective leaders in the 13Leaders framework provide guidance, coaching, and opportunities for their team members to grow and become more competent in their roles.
Leaders can draw on their intention to solve their leadership tasks. Intention describes the purposeful energy that leaders use to solve their tasks. Visions and goals are instrumental in driving direction. Good visions tend to be abstract and timeless. They reach far into the future and can never be completely fulfilled (Kirkpatrick & Locke, 1996).
Goals, on the other hand, can be directed towards a clear, temporally determined state (Locke & Latham, 1990). Their commonality is the desirable end state. Leadership includes goal setting (Northouse, 2018). For example, effective CEO’s were very good at creating their vision, communicating it and steering the organisation consistently and persistently in one direction (Bennis, 1982). Leaders rely on their vision to communicate strategies, beliefs and values (Conger & Kanungo, 1998).
Vision can make work more stimulating and employees more open to new situations (Bass, 1985). There are numerous studies that support the positive effects of vision-led leadership. Examples include organisational commitment, job satisfaction and financial performance (Kirkpatrick & Locke, 1996; Lowe et al. 1996; Waldman, Ramirez, House & Puranam, 2001). Leaders who set specific goals can direct their behaviour towards achieving them, and avoid useless behaviour (Locke & Latham, 2002). Specific goals increase focus and commitment (Chesney & Locke, 1987). Leaders who effectively formulate goals can make their goals more abstract or clear, depending on the complexity of the task (Berson, Halevy, Shamir & Erez, 2015).
Overall, the 13Leaders framework integrates SDT principles into its approach to leadership development. It emphasizes the importance of understanding and satisfying individuals’ basic psychological needs to promote intrinsic motivation, engagement, and well-being, ultimately leading to more effective and adaptive individuals, teams and organisations.
Where does 13Leaders come from?
In 2020, we began developing the test. First, we researched leadership styles, conceptualised a model, and then created questions to make that model measurable.
We hit on three categories, pretty quickly, that are commonly found in the literature: Confidence, goal setting, and employee development:
Confidence
Goal setting
Team building
We built our model on these three basic topics. Leaders can thus solve their leadership tasks with three factors: Charisma, their goals, and their team. However, leaders do not use only one factor on its one. We assumed that leaders would use a combination. The results are 13 different possible combinations of the characteristics. Et voila: 13 different leadership types. Now we were allowed to fill the types with content based on the combination of the three factors.
Questionnaire Construction
In test construction, questions are called items. We created the items for our test using Logical Item Creation. This means that we created items by logical reasoning based on the literature and our theoretical model. We assumed that these items could measure identity, intention, and integration.
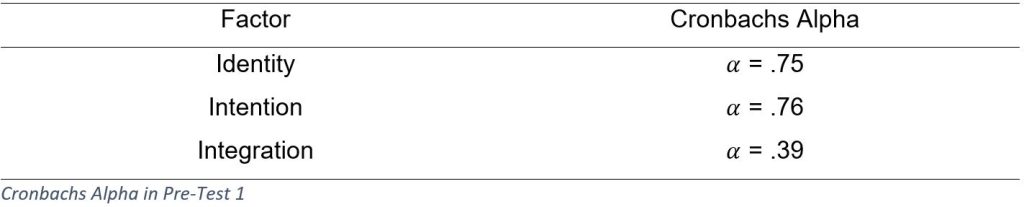
Each item was rated by test takers on a Likert scale from 1 to 5. Unlike currently, we did not confront the items. More on this later. If one wants to know how good the items are, there are several tests to check this. We calculated a Cronbach’s alpha for the first draft of our questions with 109 participants. The results are in the table.
„
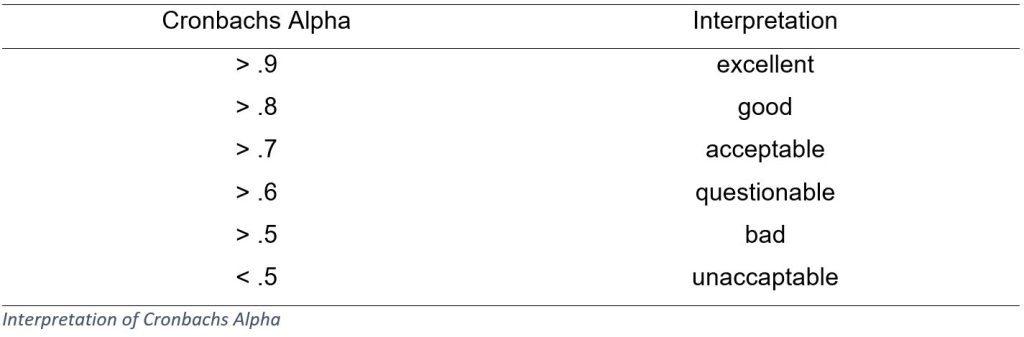
How is Cronbach’s Alpha interpreted?
Conbrach’s Alpha measures internal consistency. In other words, it is a reliability measure. We use alpha to describe the extent to which the items on a test measure a construct (Tavakol & Dennick, 2011). When we develop a test that measures depression, for example, different items on a scale should measure a construct (e.g., listlessness). However, we do not ask “Are you listless?”. A researcher generates different items that all try to measure listlessness. These items should measure in the same direction, which is what Cronbach’s Alpha tests.
The table shows a simple guide for the interpretation of Cronbrachs Alpha (Gliem & Gliem 2003).
After you read the table, you see that our Cronbach’s alpha for the intention factor was unacceptable. The questions were measured crosswise and not in one direction, like those for identity and integration. So we had to formulate new items for Intention. Not all the questions had to be thrown out. It’s easy to see which items work quite well and which don’t. We kept the best ones and formulated a few new ones. A second pretest then gave us an acceptable score for Intention (α = .74).
The next challenge came quickly. All three factors correlated very strongly with each other. That is, high expressions in one factor are associated with high expressions in the other factor and vice versa. Do people want to be good at all three factors? Or are we perhaps measuring the same thing three times? We couldn’t be sure, but we knew we had to change something. So the same type of leadership would always come out.
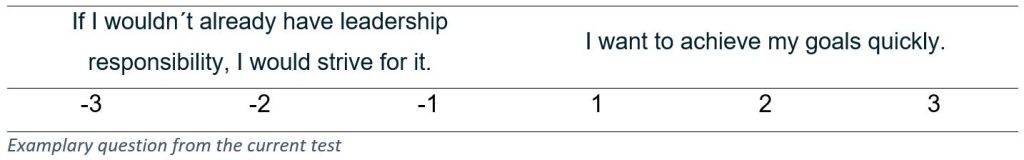
The solution to our problem was to contrast the factors. We force our testers to choose between one of the two factors. This sounds harsh, but it is common in test construction. It’s called forced choice.
In the example, you can see how we contrast identity with intention. You contrast 15 times during one test.
Where do we stand to date?
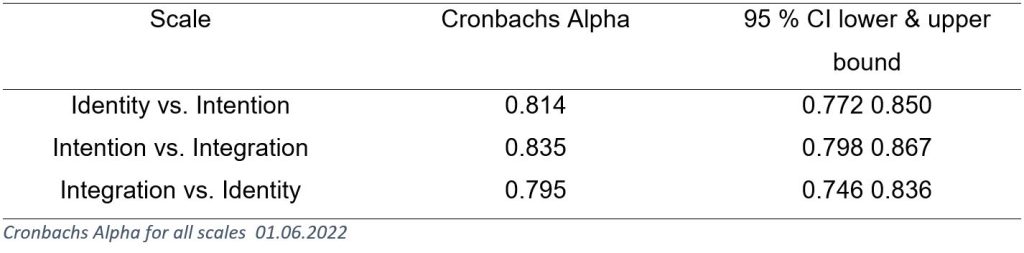
Since we decided to contrast the scales, we again had to measure the internal consistency of the 13Leaders questionnaire. N = 225 test participants were included in the evaluation. You can see from the table that we calculated acceptable to good Cronbach’s alpha.
You can see that a new value has been added. We still show you the confidence interval for each Cronbach’s alpha. For multiple (infinitely many) measurements, our Cronbach’s alpha is within the confidence interval in 95% of the measurements. We know this is a strange interpretation. For complaints, you can turn to the grandchildren of Neyman and Pearson.
Having examined internal consistency, we have one more thing to check. We now know that the individual scales each measure in one direction. Do they measure something differently?
Factor Analysis
In constructing tests, we don’t want to measure one construct with one question. We ask several questions that measure the same thing. That is called face validity. Of course, the questions must also be defensible according to our theoretical understanding. Ultimately, what matters is whether the pooled variables share variance.
We conducted an exploratory factor analysis, which we will explain in more detail.
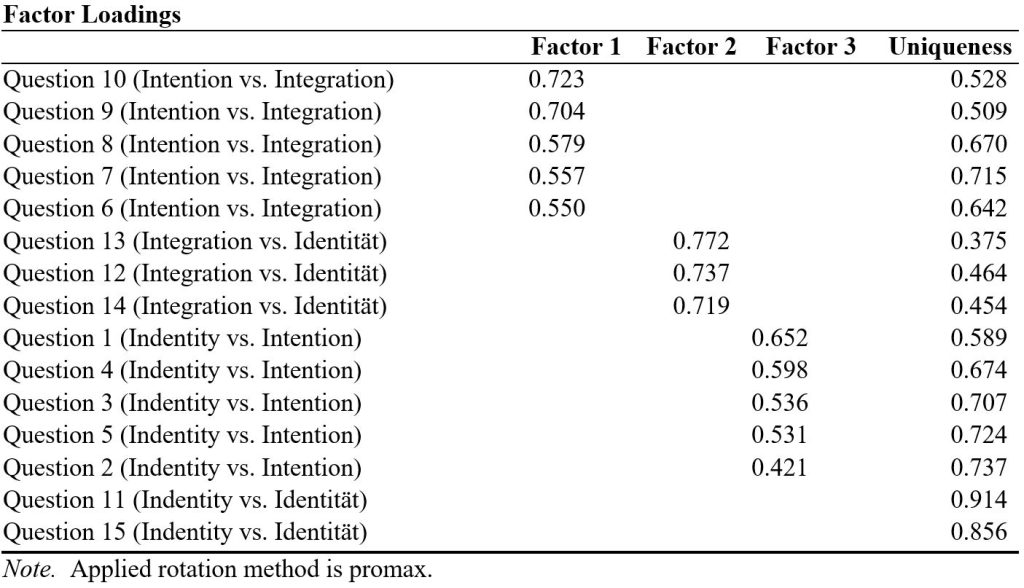
The last factor analysis brought question 11 to our attention. The question did not fit any factor. The uniqueness was (0.719), which was very large. A large uniqueness means that the question cannot be explained by any factor. It is the variance that cannot be explained by any factor.
Here you can see the new factor analysis. We have changed question 11 and question 12. Both were dropped in the last factor analysis. It is good that question 12 is currently bundled in factor 3. Surprisingly, question 11 is even worse than in the last factor analysis and in addition question 15 is not bundled either.
Factor 1 bundles items 12 to 14 and represents the preference between integration and identity. Factor 2 bundles items 1 to 5 and is interpreted by us as the preference between identity and intention. Factor 3 bundles items 6 through 10 and represents the preference between intention and integration.
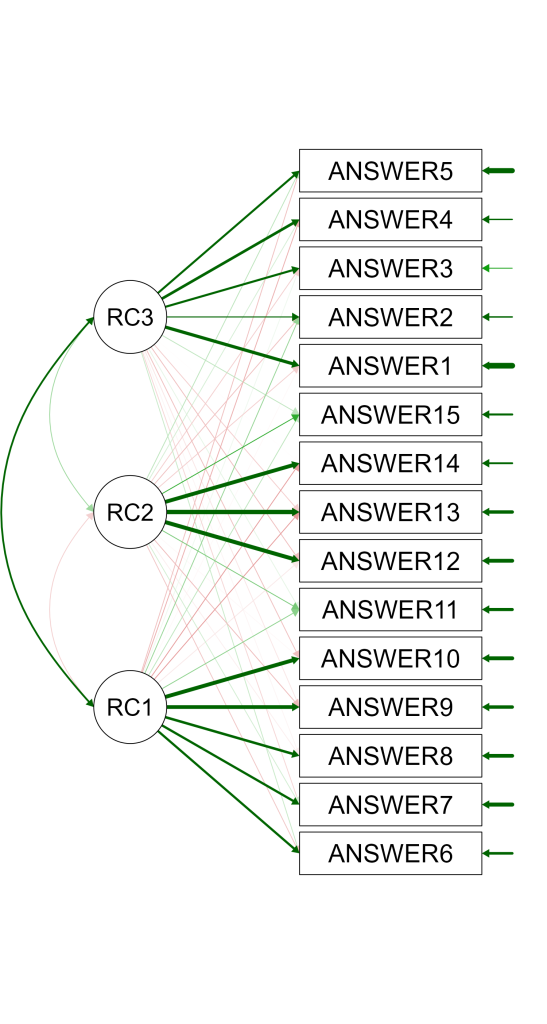
The relationship between the items and the factors can be more easily represented in a path diagram. Here you can see how strongly the items load on a factor and whether the factors are related. It shows that factors 1 and 3 are slightly correlated. We still investigate why this might be the case.
Path Diagram
The factor analysis was computed with an Oblique promax rotation, since we assumed that there could be correlations between the factors. We chose to use maximum likelihood estimation (MLE) in the calculation. MLE calculates under which factors the underlying correlation matrix is most likely. Additionally, we looked at the RMSEA value. This allows us to examine how well our three-factor model fits the data. We also calculated the fit of our model (RMSEA = .054, 90% CI .048 – .059, BIC = – 117.665).
Where are we heading?
Currently, over 3.500 leaders have successfully completed the test (May 2023). We can get a lot of information from the data.
Distribution of the answers in each scale.
When leaders are asked to decide between their identity and intention, we see an even distribution. Leaders prefer their intention slightly more compared to identity. Integration is clearly preferred to identity in the comparison. Decisions between Intention and Integration are similar to the first scale.
Whether identity or intention, integration is almost always preferred on average. Most leaders from our sample prefer to lead with their employees. We noticed this distribution early in the development of the test. At that time, we had a smaller sample. Now a couple of thousands responses later, we are more certain that this distribution is not a coincidence of our measurement.
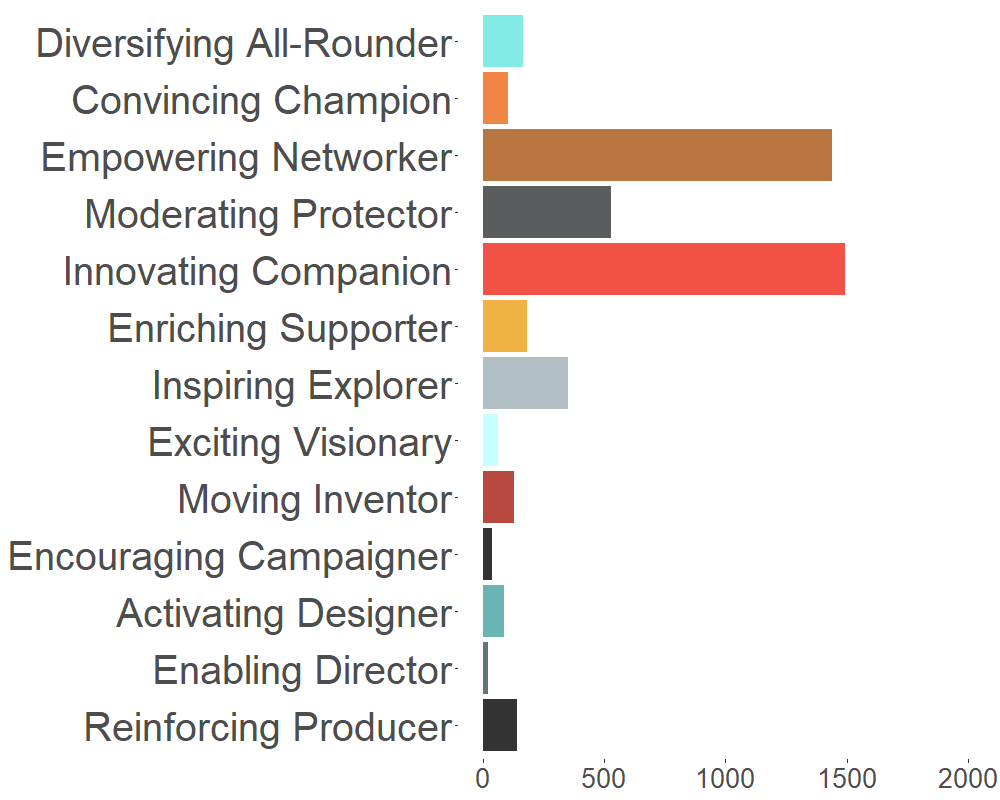
Leader Distribution
In the distribution of leaders, we can see that leaders with strong identity expressions are evaluated less frequently. This is also what we would expect if integration is particularly favored compared with identity.
Types by Gender
We find no gender effects on the distribution of Leaders. In general, fewer men than women took the 13Leaders test. Therefore, we always see fewer men than women in the distribution.
Here you can see the company size distributed among the leaders. As with gender, we cannot identify any significant effects here.
Where are we heading?
We deal openly with the fact that not everything is perfect from the start. The development of our questions is exciting. We don’t want to keep that from you. In the meantime, our test is made several times a day. This gives us enough data to make good calculations. This helps us to constantly improve the test and keep you up to date. 😊
You can help us with this. Take our test and give us feedback
Our methods and this text will be updated regularly. ‘in the meantime, do get in touch, we value our opinions.
Your 13Leaders Team.
Literature
Alznauer, M. (2016), [translated by Peter Rost]. Leading Naturally – The Evolutionary Source Code of Leadership. Heidelberg: Springer.
Baard, P. P., Deci, E. L., & Ryan, R. M. (2004). Intrinsic need satisfaction: A motivational basis of performance and well-being in two work settings. Journal of Applied Social Psychology, 34(10), 2045–2068.
Bandura, A. (1986). Social foundations of thought and action: Social cognitive theory. Englewood Cliffs, NJ: Prentice Hall.
Barling, J., Christie, A., & Hoption, C. (2010). Leadership. In S. Zedeck (Ed.), Handbook of industrial and organizational psychology (pp. 183–240). Washington, DC: American Psychological Association.
Bass, B.M. (1985). Leadership and performance beyond expectations. New York: Free Press.
Berson, Y., Halevy, N., Shamir, B., & Erez, M. (2015). Leading from different psychological distances: A construal-level perspective on vision communication, goal setting, and follower motivation. The Leadership Quarterly, 26(2), 143-155.
Boehm, C., & Boehm, C. (2009). Hierarchy in the forest: The evolution of egalitarian behavior. Harvard University Press.
Carlyle, T. (1888). On heroes, hero-worship and the heroic in history, Fredrick A. Stokes & Brother, New York, 2.
Chesney, A. A., & Locke, E. A. (1991). Relationships among goal difficulty, business strategies, and performance on a complex management simulation task. Academy of Management Journal, 34(2), 400–424.
Conger, J. A., & Kanungo, R. N. (1998). Charismatic leadership in organizations. Thousand Oaks, Calif.: Sage Publications.
De Cremer, D., & Van Knippenberg, D. (2004). Leader self-sacrifice and leadership effectiveness: The moderating role of leader self-confidence. Organizational behavior and human decision processes, 95(2), 140-155.
Deci, E. L., Olafsen, A. H., & Ryan, R. M. (2017). Self-determination theory in work organizations: the state of a science. Annual Review of Organizational Psychology and Organizational Behavior, 4, 19–43.
Emery, F. E., Thorsrud, E., & Trist, E. (1969). Form and content in industrial democracy. Van Gorcum.
Fischhoff, I. R., Sundaresan, S. R., Cordingley, J., Larkin, H. M., Sellier, M. J., & Rubenstein, D. I. (2007). Social relationships and reproductive state influence leadership roles in movements of plains zebra, Equus burchellii. Animal Behaviour, 73(5), 825-831.
Fransen, K., Steffens, N. K., Haslam, S. A., Vanbeselaere, N., Vande Broek, G., & Boen, F. (2016). We will be champions: Leaders’ confidence in ‘us’ inspires team members’ team confidence and performance. Scandinavian journal of medicine & science in sports, 26(12), 1455-1469.
Gilbert, S. L., & Kelloway, E. K. (2014). Leadership. In M. Gagné (Ed.), The Oxford handbook of work engagement, motivation, and self-determination theory (pp. 181–198). New York: Oxford University Press.
Grabo, A., Spisak, B. R., & van Vugt, M. (2017). Charisma as signal: An evolutionary perspective on charismatic leadership. The Leadership Quarterly, 28(4), 473-485.
Hardré, P. L., & Reeve, J. (2009). Training corporate managers to adopt a more autonomy-supportive motivating style toward employees: an intervention study. International Journal of Training and Development, 13(3), 165–184.
Hersey, P. & Blanchard, K. H. (1977). Management of Organizational Behavior: Utilizing Human Resources (3d ed.). Englewood Cliffs, N.J.: Prentice-Hall.
Hersey, P., Blanchard, K. H., & Johnson, D. E. (2007). Management of organizational behavior (Vol. 9). Upper Saddle River, NJ: Prentice hall.
Herzberg, F., Mausner, B. and Snyderman, B.B. (1959), The Motivation to Work, John Wiley & Sons, New York, NY.
Hogan, R., & Kaiser, R. B. (2005). What we know about leadership. Review of general psychology, 9(2), 169-180.
Kaplan, R. M., & Saccuzzo, D. P. (2013). Psychological assessment and theory: Creating and using psychological tests. Wadsworth Cengage Learning.
Kirkpatrick, S. A., & Locke, E. A. (1996). Direct and indirect effects of three core charismatic leadership components on performance and attitudes. Journal of Applied Psychology, 81(1), 36–51.
Likert, R. (1961). New patterns of management.
Locke, E. A., & Latham, G. P. (1990). A theory of goal setting & task performance. Prentice-Hall, Inc.
Locke, E. A., & Latham, G. P. (2002). Building a practically useful theory of goal setting and task motivation: A 35-year odyssey. American Psychologist, 57(9), 705–717.
Lowe, K. B., Kroeck, K., & Sivasubramaniam, N. (1996). Effectiveness correlates of transformation and transactional leadership: A meta-analytic review of the MLQ literature. The Leadership Quarterly, 7(3), 385–425.
Maslow, A. H. (1954). The instinctoid nature of basic needs. Journal of personality.
Northouse, P. G. (2018). Leadership: Theory and practice. Sage publications.
Roethlisberger, F. J., & Dickson, W. J. (2003). Management and the Worker (Vol. 5). Psychology press.
Rost, J.C. (1991). Leadership for the Twenty-First Century. New York: Praeger
Shepardson, M. (1963). Navajo ways in government: a study in political process (No. Sirsi) a451545).
Su, Y. L., & Reeve, J. (2011). A meta-analysis of the effectiveness of intervention programs designed to support autonomy. Educational Psychology Review, 23(1), 159–188.
Tavakol, M., & Dennick, R. (2011). Making sense of Cronbach’s alpha. International journal of medical education, 2, 53.
Taylor, F. W. (1911). The principles of scientific management. New York, 202.
Vroom, V. H. (1964). Work and Motivation. New York: Wiley and Sons.
Van Vugt, M., & Smith, J. E. (2019). A dual model of leadership and hierarchy: Evolutionary synthesis. Trends in Cognitive Sciences, 23(11), 952-967.
Waldman, D. A., & Yammarino, F. J. (1999). CEO charismatic leadership: Levels-of-management and levels-of-analysis effects. Academy of management review, 24(2), 266-285.